The latest news and research from our partners. Subscribe to our mailing list for more.

April 21, 2025 – Bloomberg Markets: The Close – Nancy Davis Talks Volatility and IVOL

October 23, 2024 – Owning Inflation with Nancy Davis
April 20, 2023 – Before SVB Collapse, Nancy Davis Warned of “Short Fixed-Income Volatility Exposure” on CNBC

April 3, 2023 – Has the US Fed Put Inflation Aside to Focus on the Banking Crisis?
KFA Funds is a premier platform for developing and delivering differentiated, high-conviction investment strategies to global investors. Our newsletter is a collaboration between our internal research department and our distinguished partners. Together we strive to offer differentiated perspectives on high-conviction investment strategies and themes.
280 Park Avenue, 32nd Floor
New York, NY 10017
155 Sansome Street, Suite 400
San Francisco, CA 94104
181 Queen Victoria Street
London EC4V 4EG
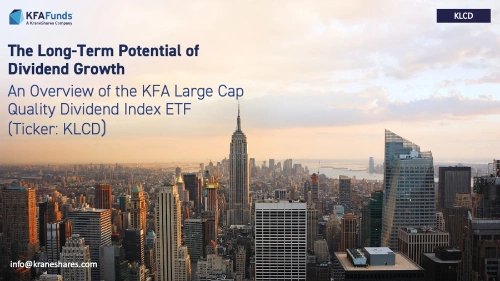
KLCD is benchmarked to the Russell 1000 Dividend Select Equal Weight Index, which takes a smart beta1 approach to investing in US Large Cap companies. The strategy seeks to measure the performance of US companies that have successfully increased their dividend payments over a period of ten years. The Index is designed to provide a benchmark for investors looking to capture a concentrated portfolio of constituents demonstrating increased dividends and positive momentum.
1. Smart beta is an investment style where a manager follows an index designed to take advantage of perceived systematic biases or inefficiencies in the market.
2. “Harnessing the Long-Term Potential of Dividend Growth.” FTSE Russell, Nov. 2018.
3. Alpha is the active return on an investment, gauges the performance of an investment against a market index or benchmark which is considered to represent the market's movement as a whole.
| Ticker | KLCD |
| Primary Exchange | NYSE |
| CUSIP | 500767728 |
| ISIN | US5007677280 |
| Net Assets | $5,863,142 |
| Shares Outstanding | 200,002 |
| Total Annual Fund Operating Expense | 0.40% |
| Inception Date | 6/12/2019 |
| Distribution Frequency | Annual |
| Daily Net Asset Value (NAV) and Market Price | |
| NAV | $29.32 |
| NAV Daily Change | 0.07% |
| Market Price | $29.30 |
| Market Price Daily Change | 0.00% |
| 30 Day Median Bid/Ask Spread |
0.17% |
| The ETF’s 30 Day Median Bid-Ask Spread is calculated by identifying the ETF’s national best bid and national best offer ("NBBO") as of the end of each 10 second interval during each trading day of the last 30 calendar days and dividing the difference between each such bid and offer by the midpoint of the NBBO. The median of those values is identified and that value is expressed as a percentage rounded to the nearest hundredth. | |
| NAV | Market Price | Premium/Discount |
| $29.32 | $29.30 | $-0.02 |
| Q1 2023 | |
| Days traded at premium | 9 |
| Days traded at NAV | 0 |
| Days traded at discount | 12 |
The Premium/Discount History chart demonstrates the difference between the daily market price of shares of the Fund and the Fund’s net asset value (NAV). The vertical axis of the chart shows the premium or discount of the daily market price as a percentage of the NAV. The horizontal axis shows each trading day in the time period, and each data point in the chart represents the Premium/Discount on that day. The data presented in the chart and table above represent past performance and cannot be used to predict future results.
| Fund NAV | Closing Price | Underlying Index | |
| 1 Month | 1.56% | 1.56% | 2.94% |
| 3 Month | 2.64% | 2.67% | 4.08% |
| 6 Month | 1.99% | 2.09% | 3.60% |
| YTD | 1.56% | 1.56% | 2.94% |
| Since Inception | 38.75% | 38.83% | 42.65% |
| Fund NAV | Closing Price | Underlying Index | |
| 1 Year | -0.53% | -0.62% | 1.11% |
| 3 Year | 8.49% | 8.51% | 9.38% |
| Since Inception | 9.41% | 9.42% | 10.24% |
| Fund NAV | Closing Price | Underlying Index | |
| 1 Year | -7.84% | -8.23% | -7.56% |
| 3 Year | 8.11% | 8.12% | 8.51% |
| Since Inception | 9.16% | 9.18% | 9.60% |
The performance data quoted represents past performance. Past performance does not guarantee future results. The investment return and principal value of an investment will fluctuate so that an investor's shares, when sold or redeemed, may be worth more or less than their original cost and current performance may be lower or higher than the performance quoted.
| 2025 Distributions and Calendar |
| Ex-Date | Record Date | Payable Date | Amount |
| 12/22/2025 | 12/22/2025 | 12/23/2025 |
Future calendar dates are subject to change. There is no guarantee that dividends will be paid. Past distributions are not indicative of future trends. This material is provided for educational purposes only and does not constitute investment advice.
Distributions are issued to brokers on the payable date, and are subject to broker payment schedules.
| 2022 Distributions |
| Ex-Date | Record Date | Payable Date | Amount |
| 12/28/2022 | 12/29/2022 | 12/30/2022 | 2.859422 |
| 2021 Distributions |
| Ex-Date | Record Date | Payable Date | Amount |
| 12/29/2021 | 12/30/2021 | 12/31/2021 | 1.505840 |
| 2020 Distributions |
| Ex-Date | Record Date | Payable Date | Amount |
| 12/29/2020 | 12/30/2020 | 12/31/2020 | 0.675625 |
| 2019 Distributions |
| Ex-Date | Record Date | Payable Date | Amount |
| 12/27/2019 | 12/30/2019 | 12/31/2019 | 0.203063 |
As interest rate markets return to a more normalized state, the Quadratic Interest Rate Volatility and Inflation Hedge ETF (Ticker: $IVOL) has shown notable strength. In a recent interview with @cvpayne, @nancy__davis, CIO of Quadratic Capital, highlights that a steepening yield… pic.twitter.com/KnVRlugs7b
— KraneShares (@KraneShares) June 6, 2025
In the face of shaky equity and bond markets, the Quadratic Interest Rate Volatility and Inflation Hedge ETF (Ticker: $IVOL) stands out. IVOL has significantly outperformed US Treasury Inflation Protected Securities (TIPS) in 2025 and has also been paying steady monthly… pic.twitter.com/HOqVPMmGzB
— KraneShares (@KraneShares) May 7, 2025
The Growth of $10,000 chart reflects an initial investment of $10,000 on the day prior to the selected time period and assumes reinvestment of dividends and capital gains. For the growth of $10,000 chart since inception, the initial investment of $10,000 is instead made on the inception date of the Fund. Fund expenses, including management fees and other expenses were deducted. The growth of a $10,000 investment in the fund is hypothetical and for illustration purposes only. Fund performance data used in this chart is based on Fund NAV and represents past performance. Past performance does not guarantee future results.
| Rank | Name | % of Net Assets | Ticker | Identifier | Shares Held | Market Value($) |
| 1 | Cash | 100.00% | – | – | 5,863,142 | 5,863,142 |
Holdings are subject to change.
Hyperlinks on this website are provided as a convenience and we disclaim any responsibility for information, services or products found on the websites linked hereto.
Click here to continueYou are now leaving KFAFunds.com. Hyperlinks on these websites are provided as a convenience and we disclaim any responsibility for information, services or products found on the websites linked hereto.
This website uses cookies to help us enhance your browsing experience. By using this website you consent to our use of these cookies. You can customize your preferences by clicking “Cookie Preferences” below. To find out more about how we use cookies and how to manage them, please see our Terms & Conditions and Privacy Policy.
Closure Announcement: Upon the recommendation of Krane Funds Advisors, LLC, the adviser to KFA Large Cap Quality Dividend Index ETF (KLCD), the Board of Trustees of KraneShares Trust has approved the liquidation and termination of KLCD. Accordingly, shares of KLCD will cease trading on the NYSE (“Exchange”), and will be closed to purchase by investors as of the close of regular trading on the Exchange on February 1, 2023 (“Closing Date”). Shareholders may sell their holdings in the Fund prior to the Closing Date. The Fund will not accept purchase orders after the Closing Date. From the Closing Date through February 10, 2023 (“Liquidation Date”), shareholders may only be able to sell their shares to certain broker-dealers. There is no assurance that there will be a market for the Fund’s shares during this period. Read More.